Wyndham Hotels & Resorts | Rooms & Rates (In Progress)
Global Hospitality & Loyalty Platform
Wyndham’s Rooms & Rates experience is a high-impact revenue screen, but users struggled to confidently compare options due to fragmented rate structures and unclear pricing hierarchy. This created friction at a critical decision point in the booking flow, impacting conversion and selection confidence.
Goals & Objectives
As part of Wyndham’s large-scale replatforming initiative across the entire website and its brands, we updated the Rooms & Rates screen to help users make more confident decisions and improve the overall experience, while also establishing a strategic roadmap for continued improvements over time. The replatforming effort gave us the opportunity to revisit past research, consolidate recurring issues, and address multiple pain points at once, while planning for more significant changes in the future.
Based on previous testing, we developed new design concepts and evaluated them through additional research to determine which improvements could be implemented immediately and which would require further validation and phased rollout in the future. We also created a simpler, more intuitive view to help users easily distinguish between room types and available rates.
Role, Collaborations, & Timeline
My Role: Lead UI/UX Designer on the web team
Cross-Functional Partners:
- Director of UX Design
- UX Research Manager
- UI/UX Designers on Web
- UI/UX Designers on App
- Product Managers
- Engineering Team
- Stakeholders: GVP of Brand Marketing, Loyalty, & Digital, VP of Digital Product
Timeline: Design portion of the project was completed over the course of 2 months. Testing and synthesis took another month. Development is still in progress since it is part of the large replatform initiative of the entire website and mobile app.
Ideation & Exploration
Reviewed and analyzed past testing results.
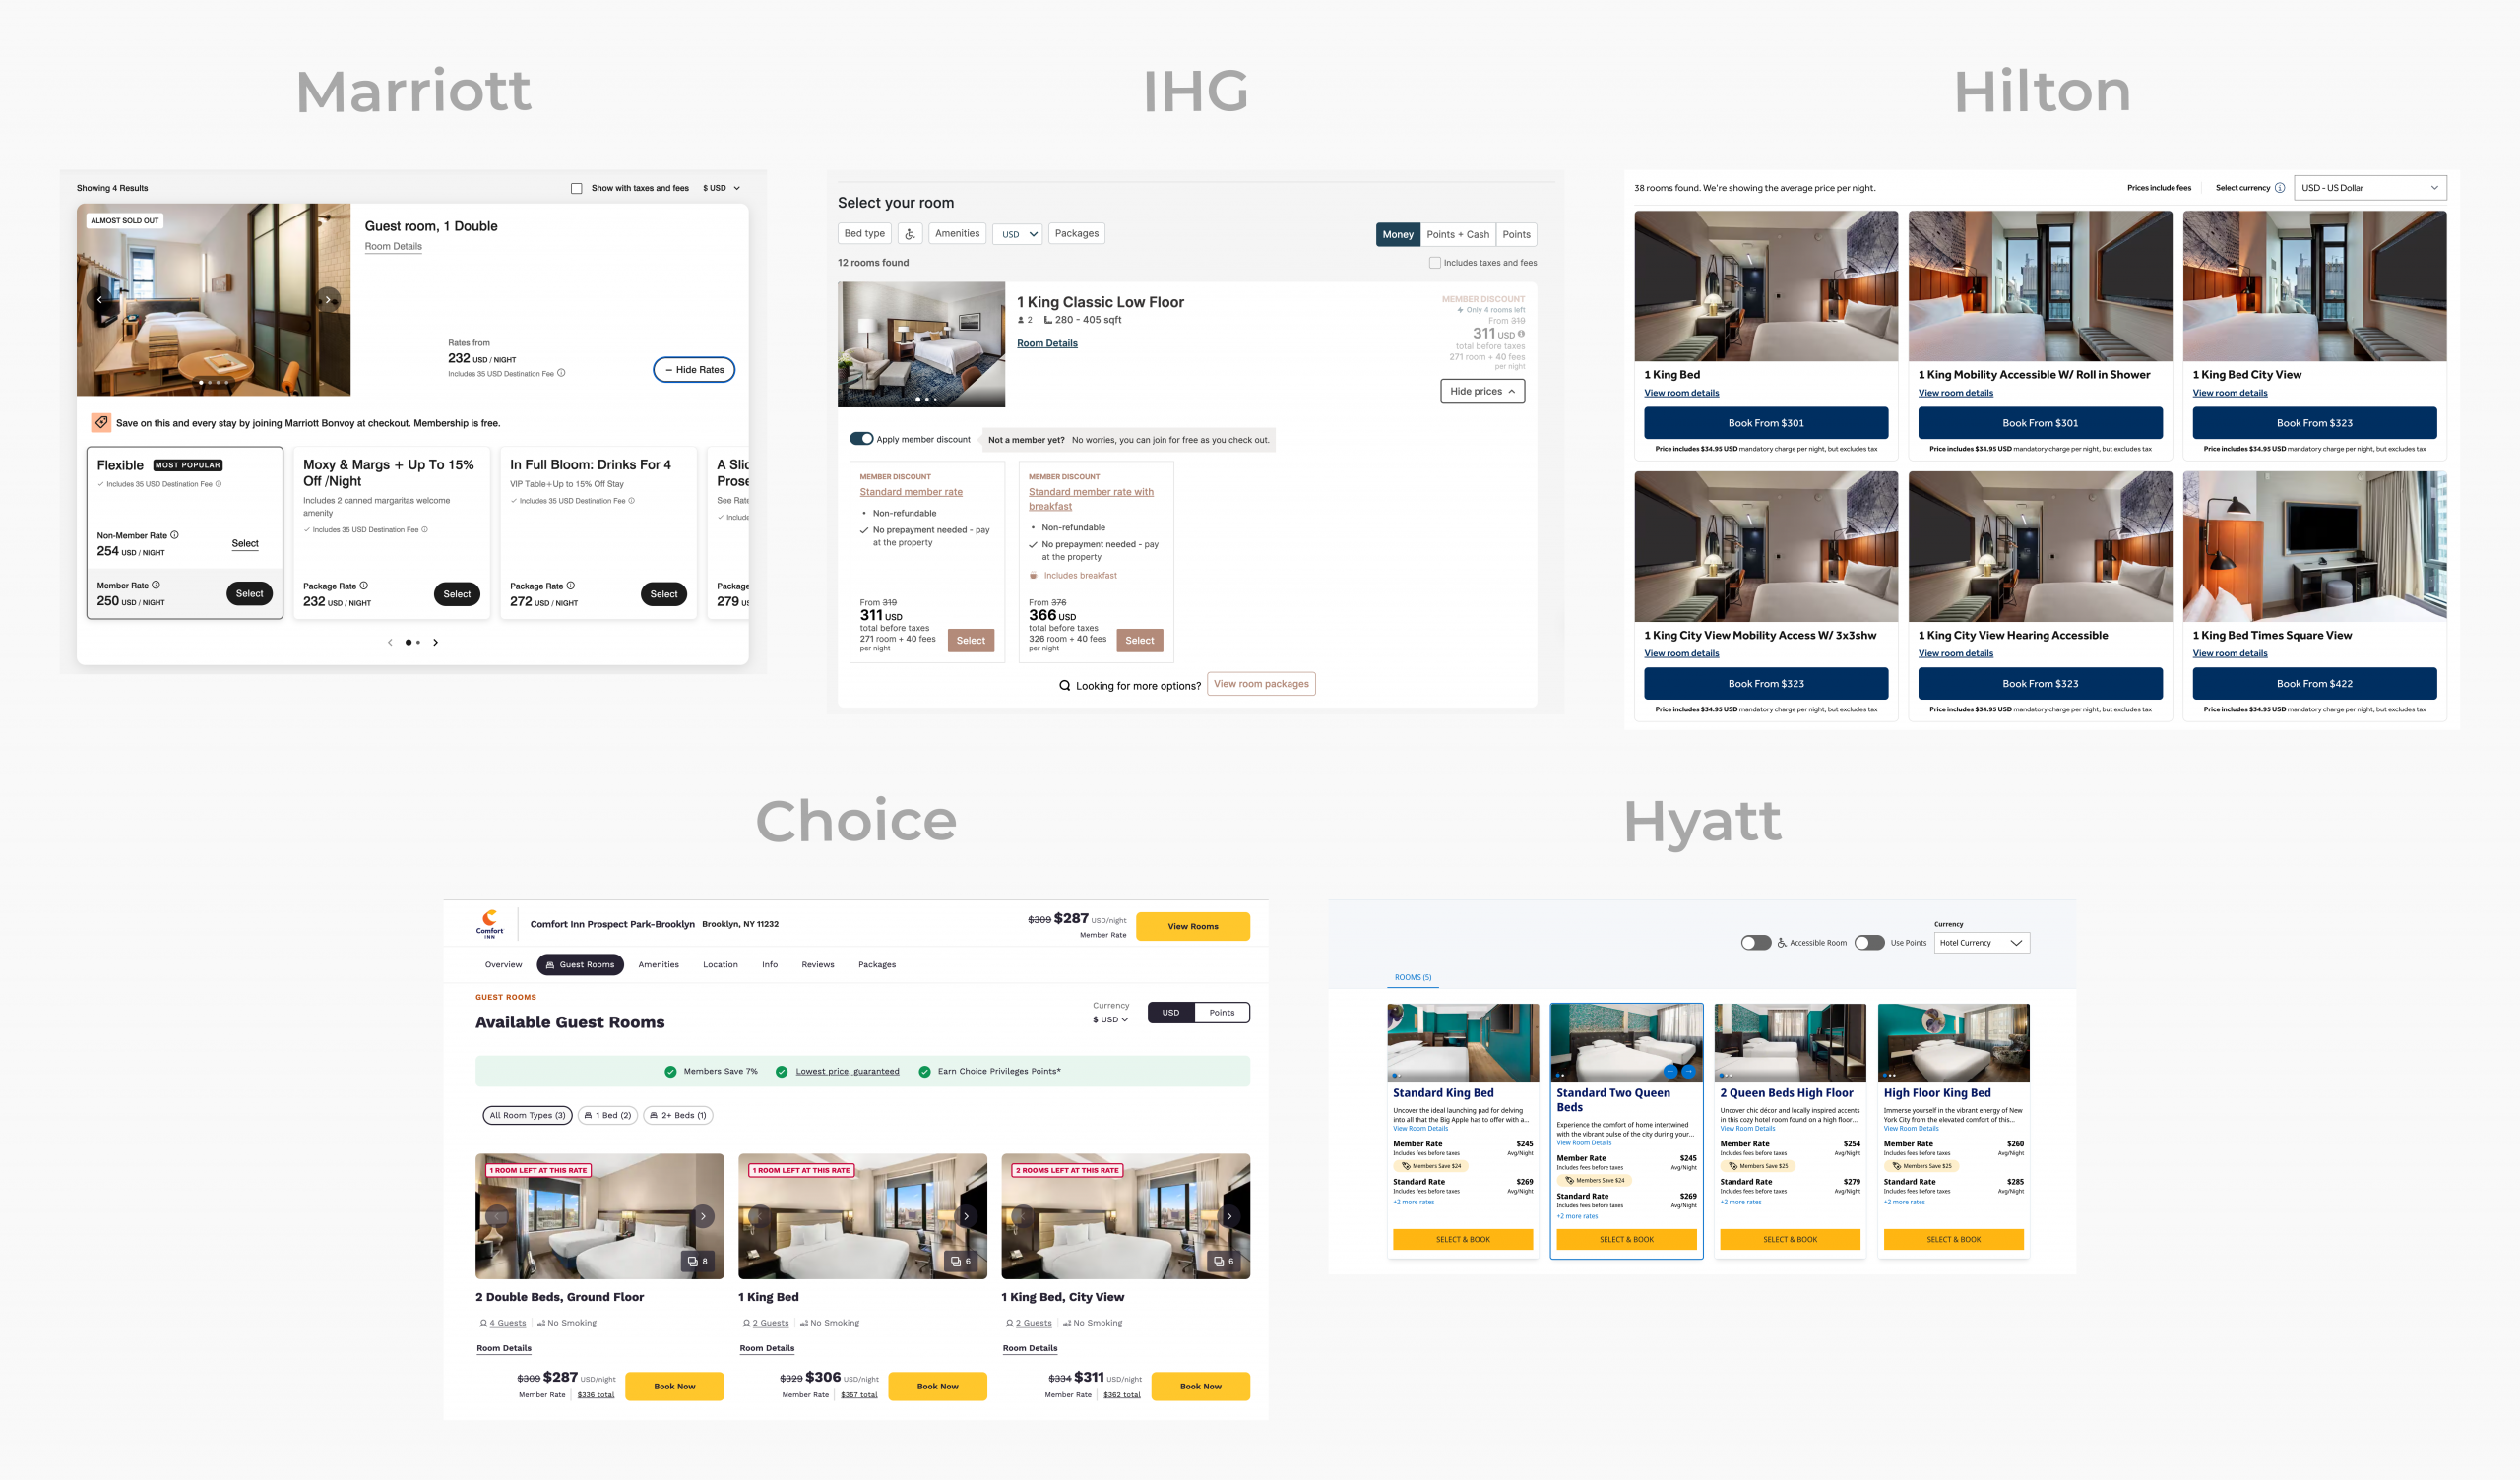
Looked at what direct competitors have done: Marriott, Hyatt, Hilton, Choice, IHG as well as Airbnb, Vrbo, Tripadvisor, Expedia. (Competitors do a mix of list or grid view of room types. Marriott, Choice, IHG had fill width list views similar to Wyndham, with option to expand other view more prices. But Choice, separates rate selection into another page and only shows starting price on rooms page and they provide more details on what each rate offers like cancellation options, breakfast, special giveaway packages. Hilton and Hyatt do grid view with about 3-4 room types across the top row.)
Some competitors separate the room selection from rate selection. To reduce engineering effort and steps for our users, we wanted to separate while also keeping them within the same step, so we’re thinking modal would make the most sense to test out and move forward with if it tests well.
Challenges & Constraints
- Wyndham has very large amenities lists and descriptions for a lot of their properties. Wyndham properties are run by franchisees, so they are in control over the length and structure of their property and room descriptions.
- Franchisees can also create new rates and put as many rates as they want per room, so it can be overwhelming to users. We’ve often hear from users that all the rates are confusing to them. Sometimes a room can have over 5 rates, but users say 3-4 max is enough. Need to reduce cognitive load.
- Wyndham doesn’t currently have a way of communicating with the thousands of franchisees on best practices for improved user experiences. Their room descriptions and rate names are often lengthy or confusing. For example: They write non-smoking in the title of each room type when the entire hotel is non-smoking.
- Current rate titles can also be vague, further confusing users. They need clear explanation of rate differences, especially regarding specific perks or inclusions for each rate. We can mitigate decision fatigue by highlighting perceivable price differences (e.g. $10/night discount for a 3-night stay) or value-added benefits (e.g. full breakfast and parking included) when offering multiple rates per room.
- This was not purely a visual redesign; the experience had to accommodate complex pricing logic, multiple rate structures, and legacy system constraints while maintaining clarity at the point of decision.
Current Issues Based on Past Tests
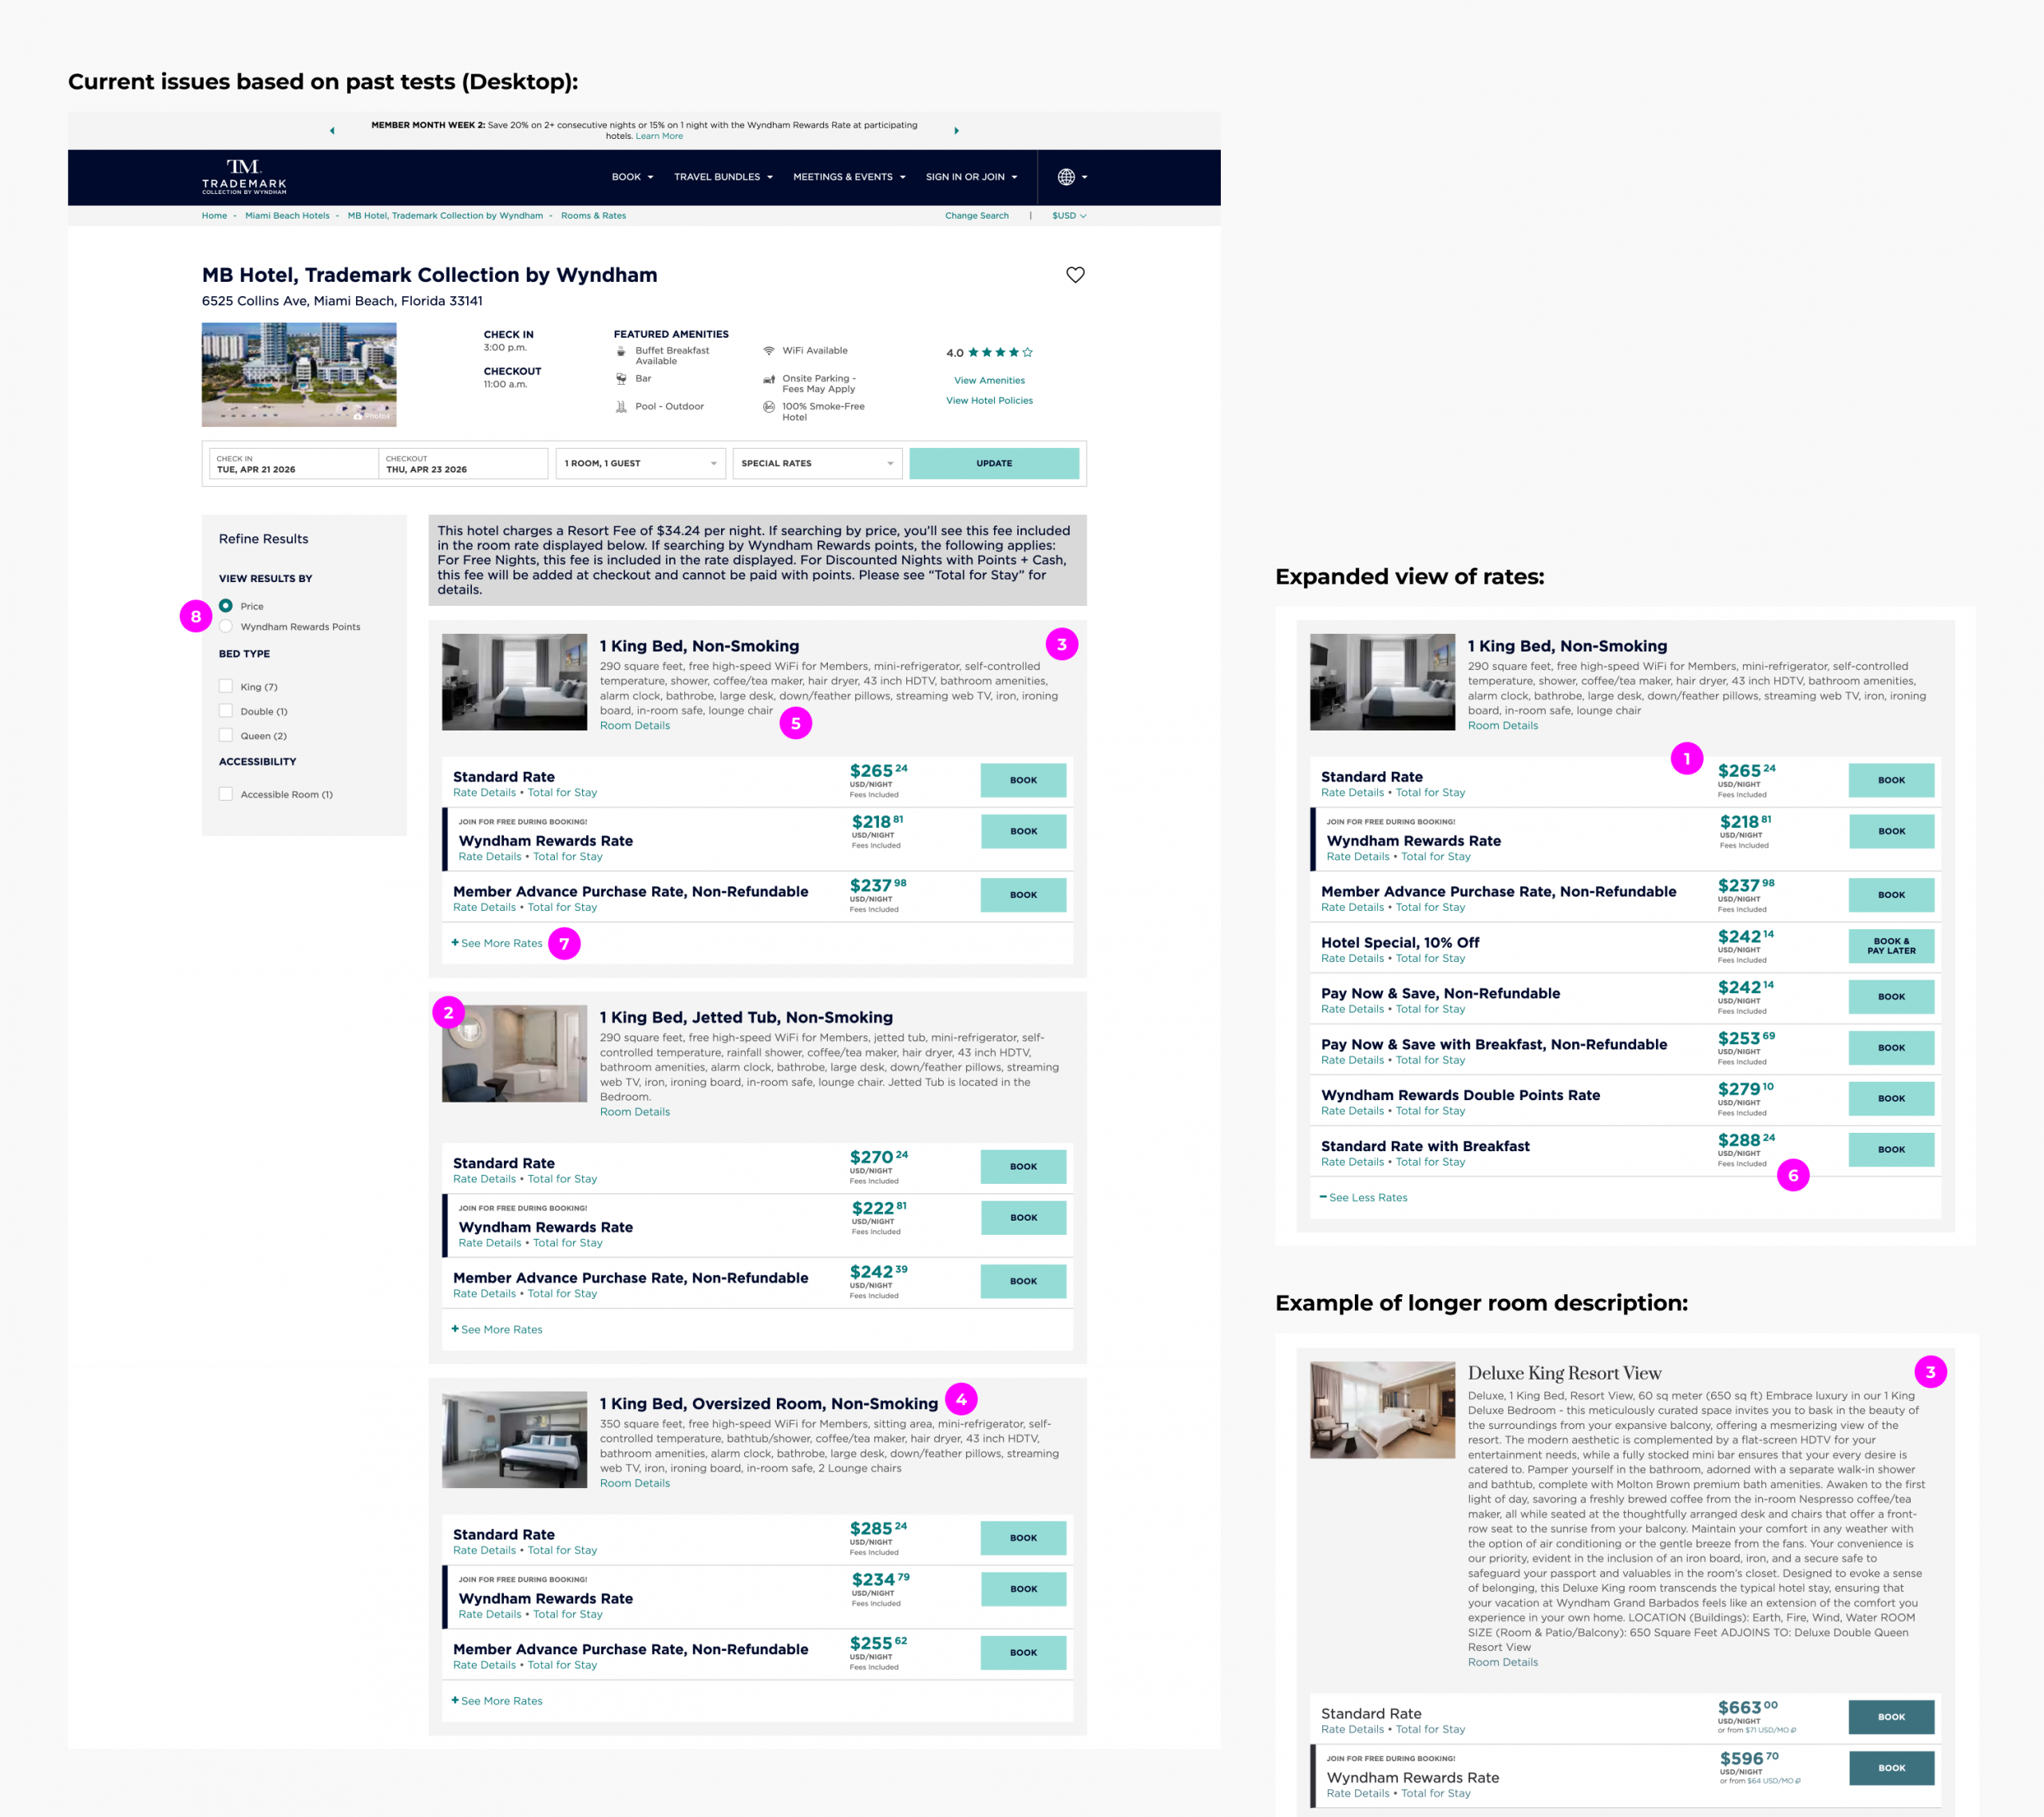
1. Too many rates displayed: Some franchisees show 6–8+ rates per room, and it’s unclear what the main differences are.
2. Small room photos make it harder for users to scan and compare.
3. Lengthy, inconsistent room details: Copy varies since franchisees write it themselves, making it harder to digest.
4. Confusing or inconsistent room type names.
5. No bullet points for key room features, which hinders quick scanning.
6. Rates not listed in descending order.
7. “See More Rates” CTA often missed: Nearly half of users didn’t notice it.
8. Price vs. Points filter is easily overlooked: Many users don’t realize they can switch between the two.
Potential Solutions Based on Testing Insights
- Limit the number of rates displayed: Most users prefer 3–4 rates per room, but some franchisees show 6–8+. Consider showing only the 2 lowest rates on first load to reduce decision fatigue, and list rates from lowest to highest.
- Larger room photos for easier scanning and comparison.
- Move room details into a modal: Copy varies in length and style since franchisees write these themselves; modals keep the page cleaner.
- Highlight “View More Rates” CTA: Only 47% of users noticed it currently—consider making it a primary button.
- Make Price vs. Points toggle more prominent: Users often miss it; better placement or visibility is needed.
- Focus on room selection: Emphasize choosing a room rather than overwhelming users with all rates.
- Reduce buttons on the page to lower cognitive load.
- Test different layouts: Try both list and grid views to see which supports our page goals best.
New Approach and Usability Testing
- We explored many designs layouts and options while also using new colors, typography, and components of the new styling we created for the whole suite of websites.
- After reviewing all the options with stakeholders, we collectively decided to make incremental changes and test further after launch to validate larger changes. We moved forward with the design that was closest to the current design, which was a list view with our new styling, and we conducted a usability test to gather insights of new designs and what we could improve on after launching new design.
- After launch, next step would be to do A/B testing on the other proposed options which were the other list views and the grid view.
UserTesting was used to perform this test. Prototypes for desktop and mobile were created, and users were asked to compare old design (production) with new design.
Goal of the New Test:
Assess users’ perception of the new designs and how easily they can make confident room and rate selections. Gather user feedback on ways to improve the overall experience.
Participant Demographics:
- Sample Size: 100 (50 desktop / 50 mobile)
- Age Range: 25 - 60
- Income: $20K - $125K
- All Genders
- Other Qualifications:
- Often book hotels when traveling
- Personally book the travel plans
- Book hotels at least once a year
- Must book hotels directly on website (desktop and mobile)
Questions for Testers:
- What do users like the most?
- What do users like the least?
- What is the most important information that users look for when searching for a room?
- Clear display of rates
- Bed type
- Number of beds
- Smoking or non-smoking
- Unique features of the room
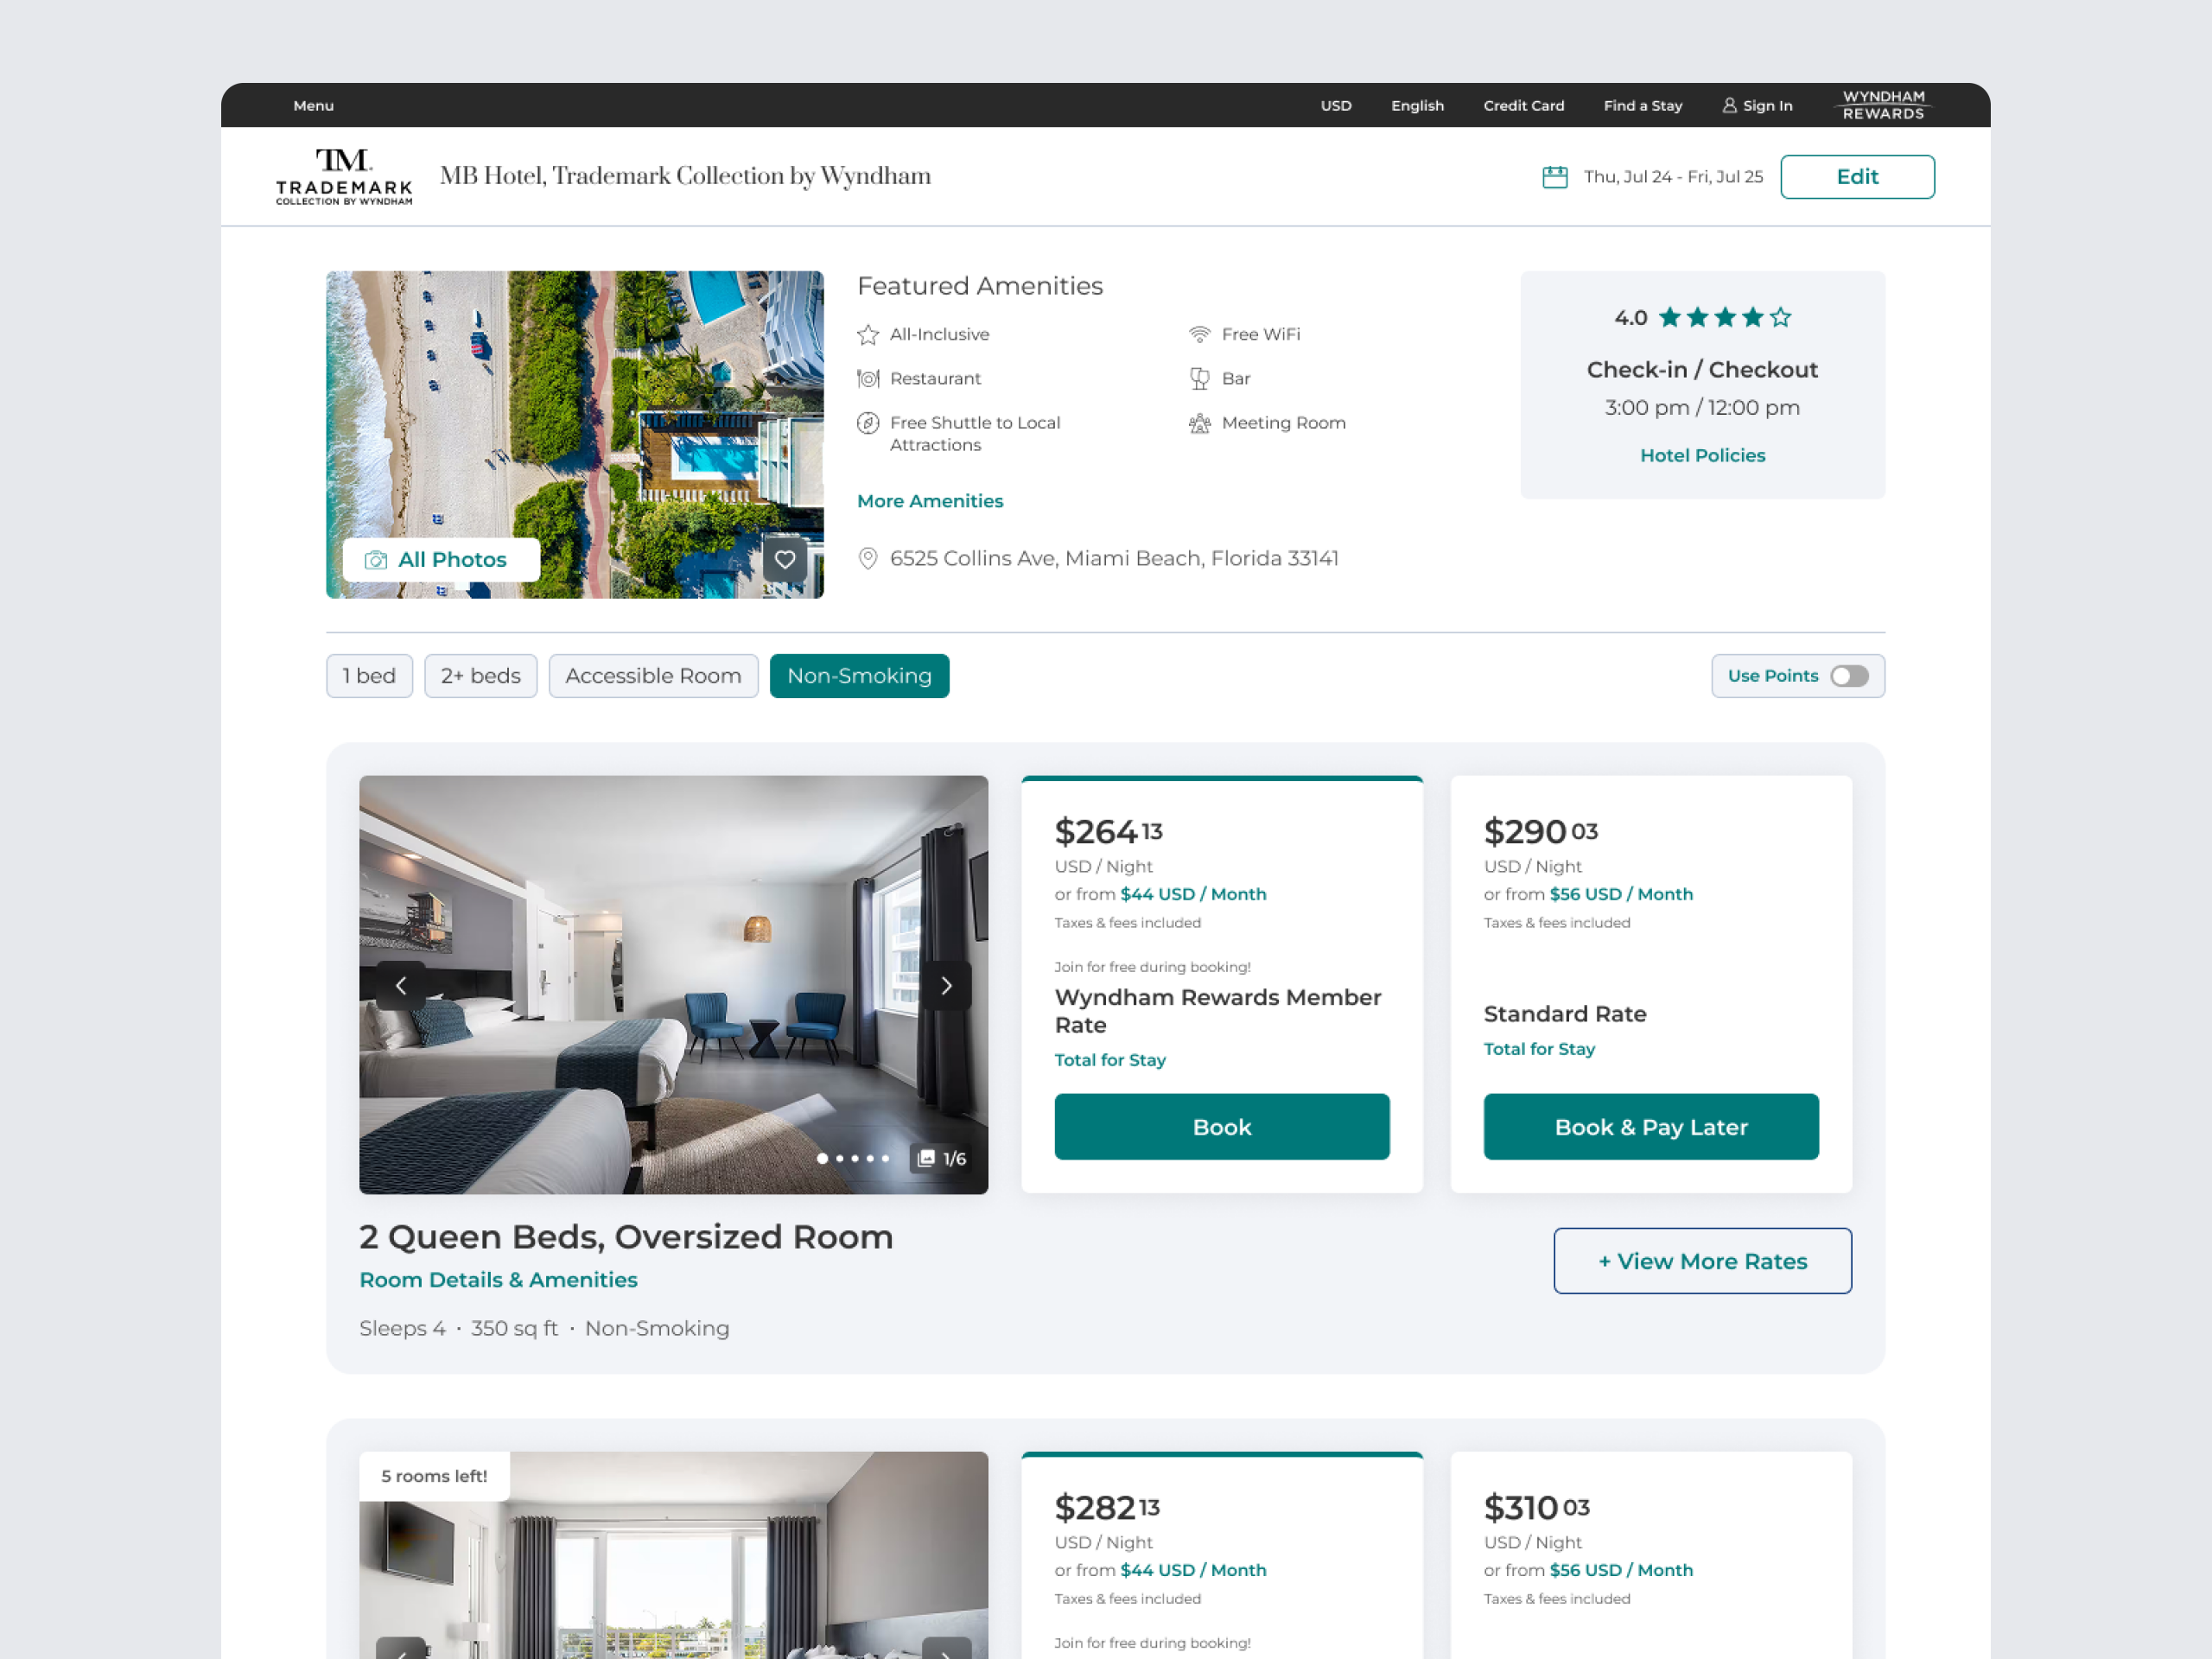
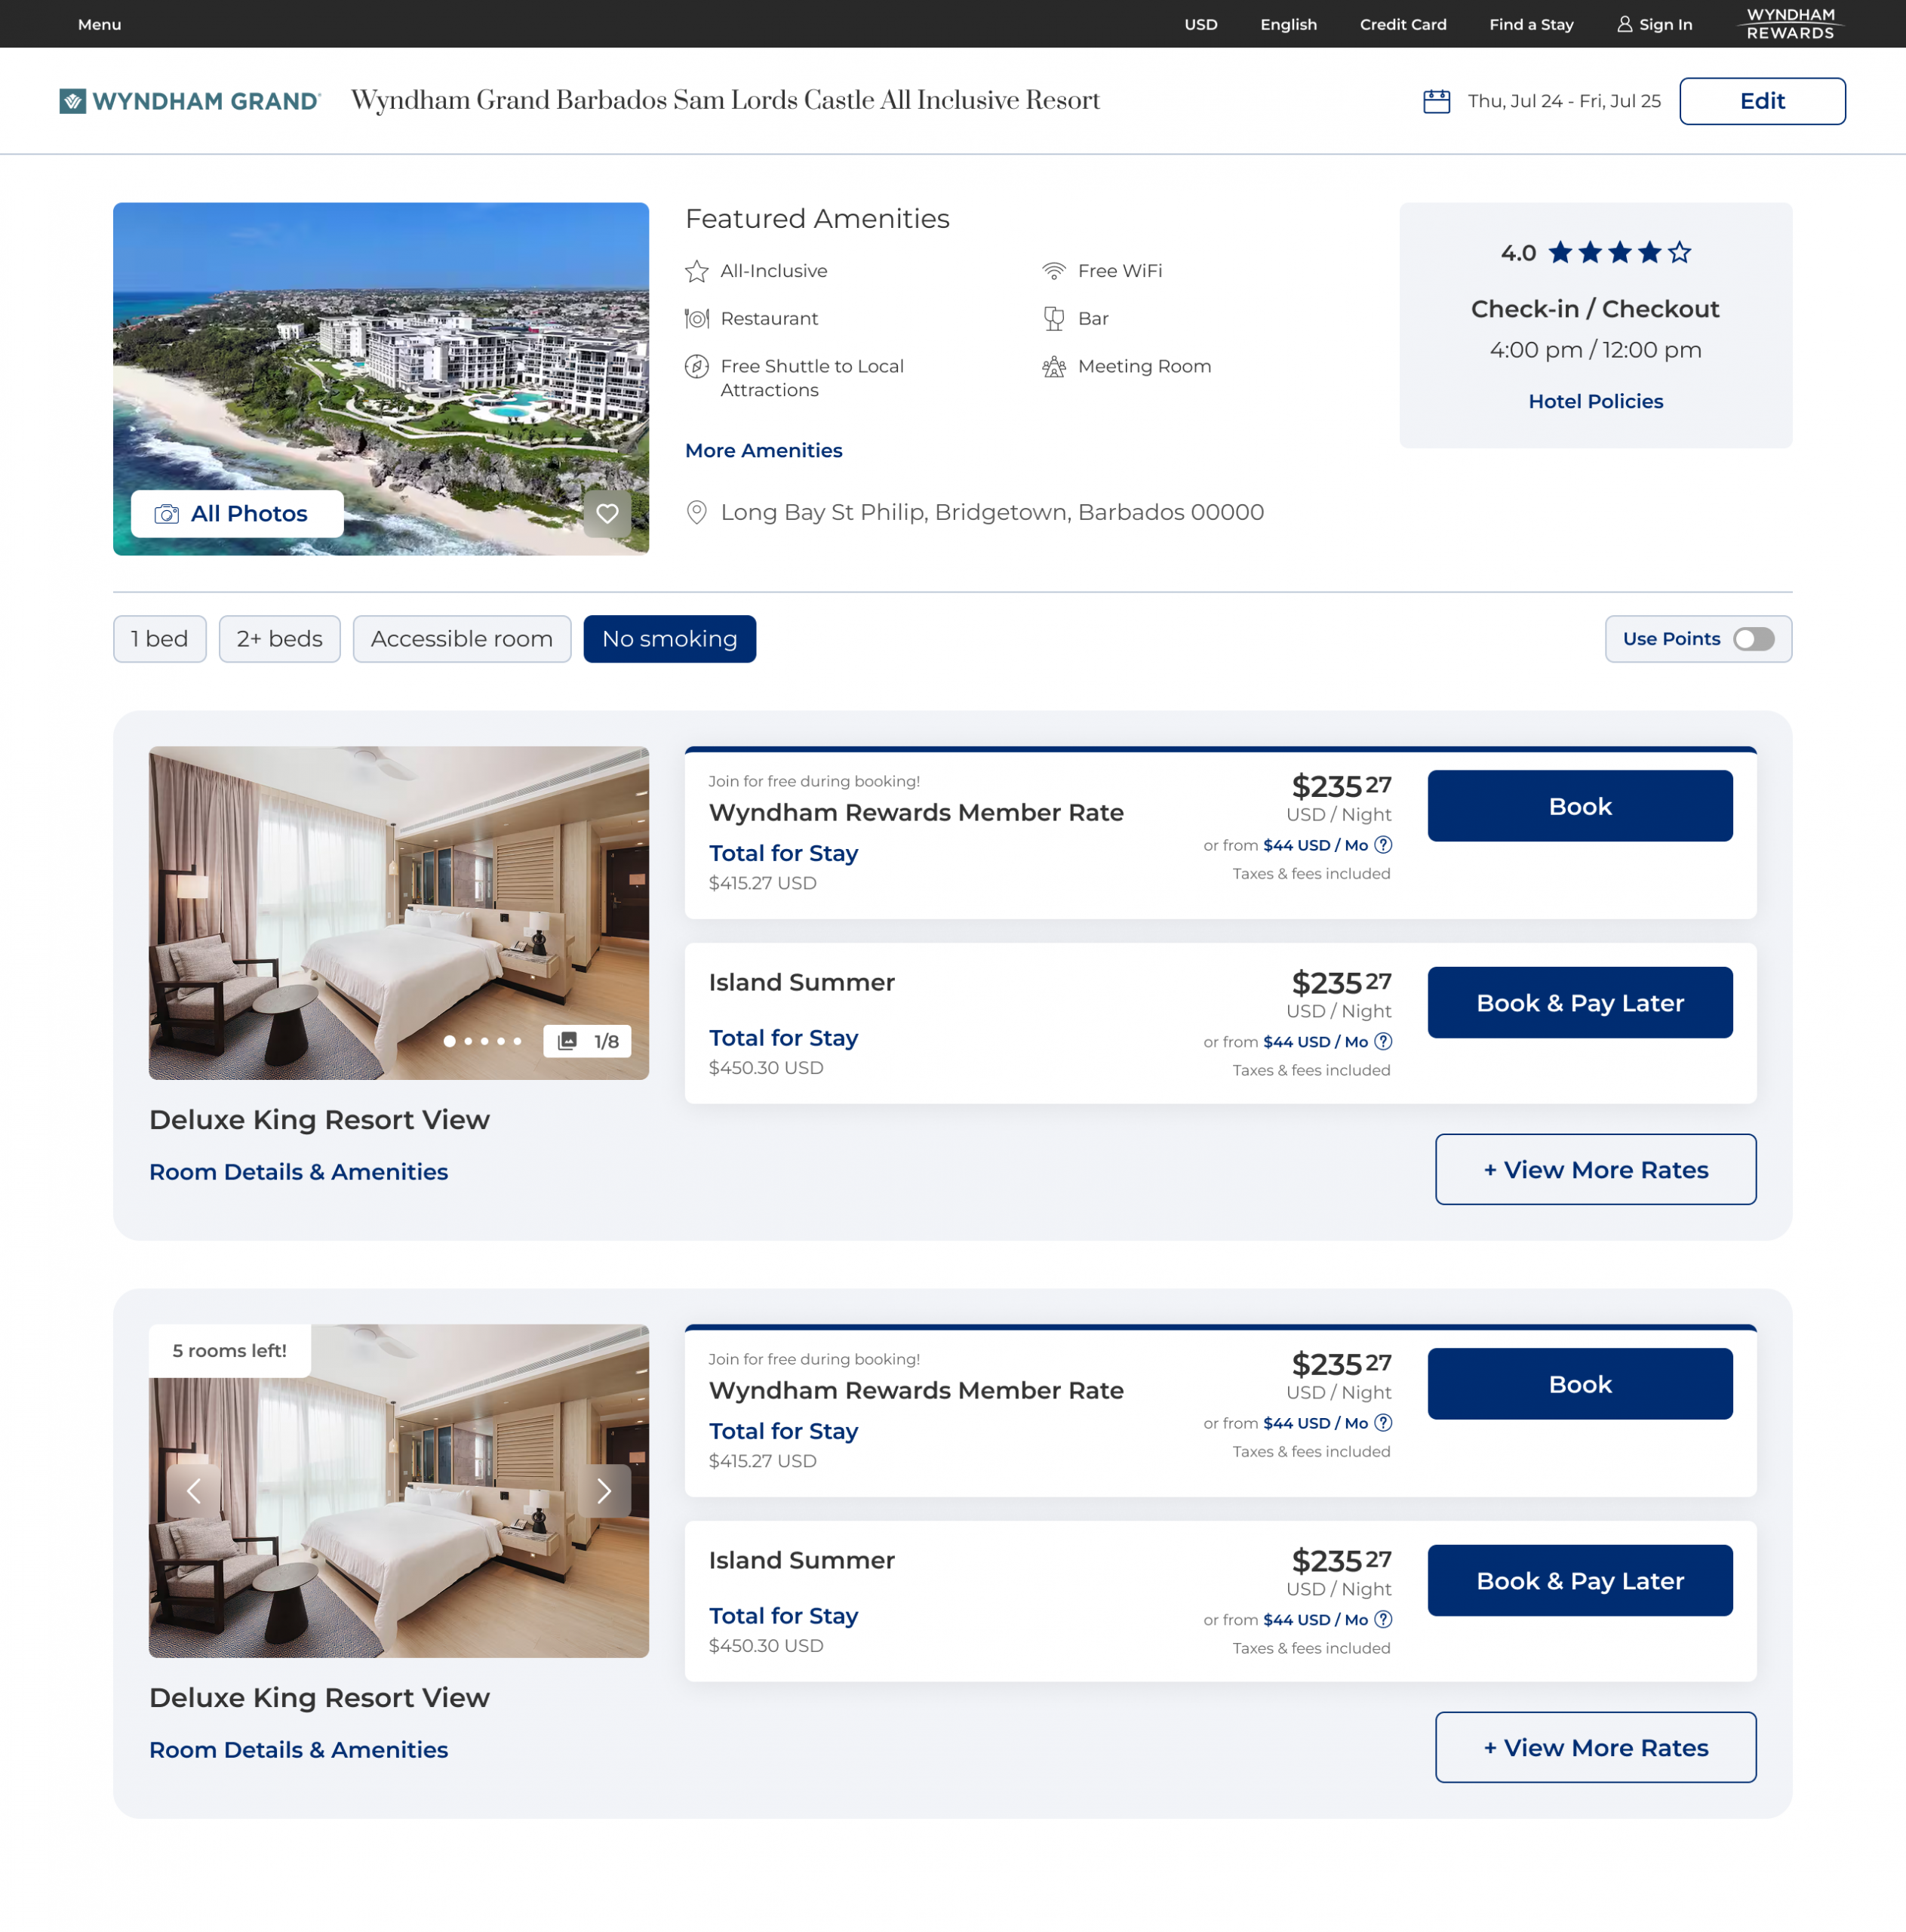
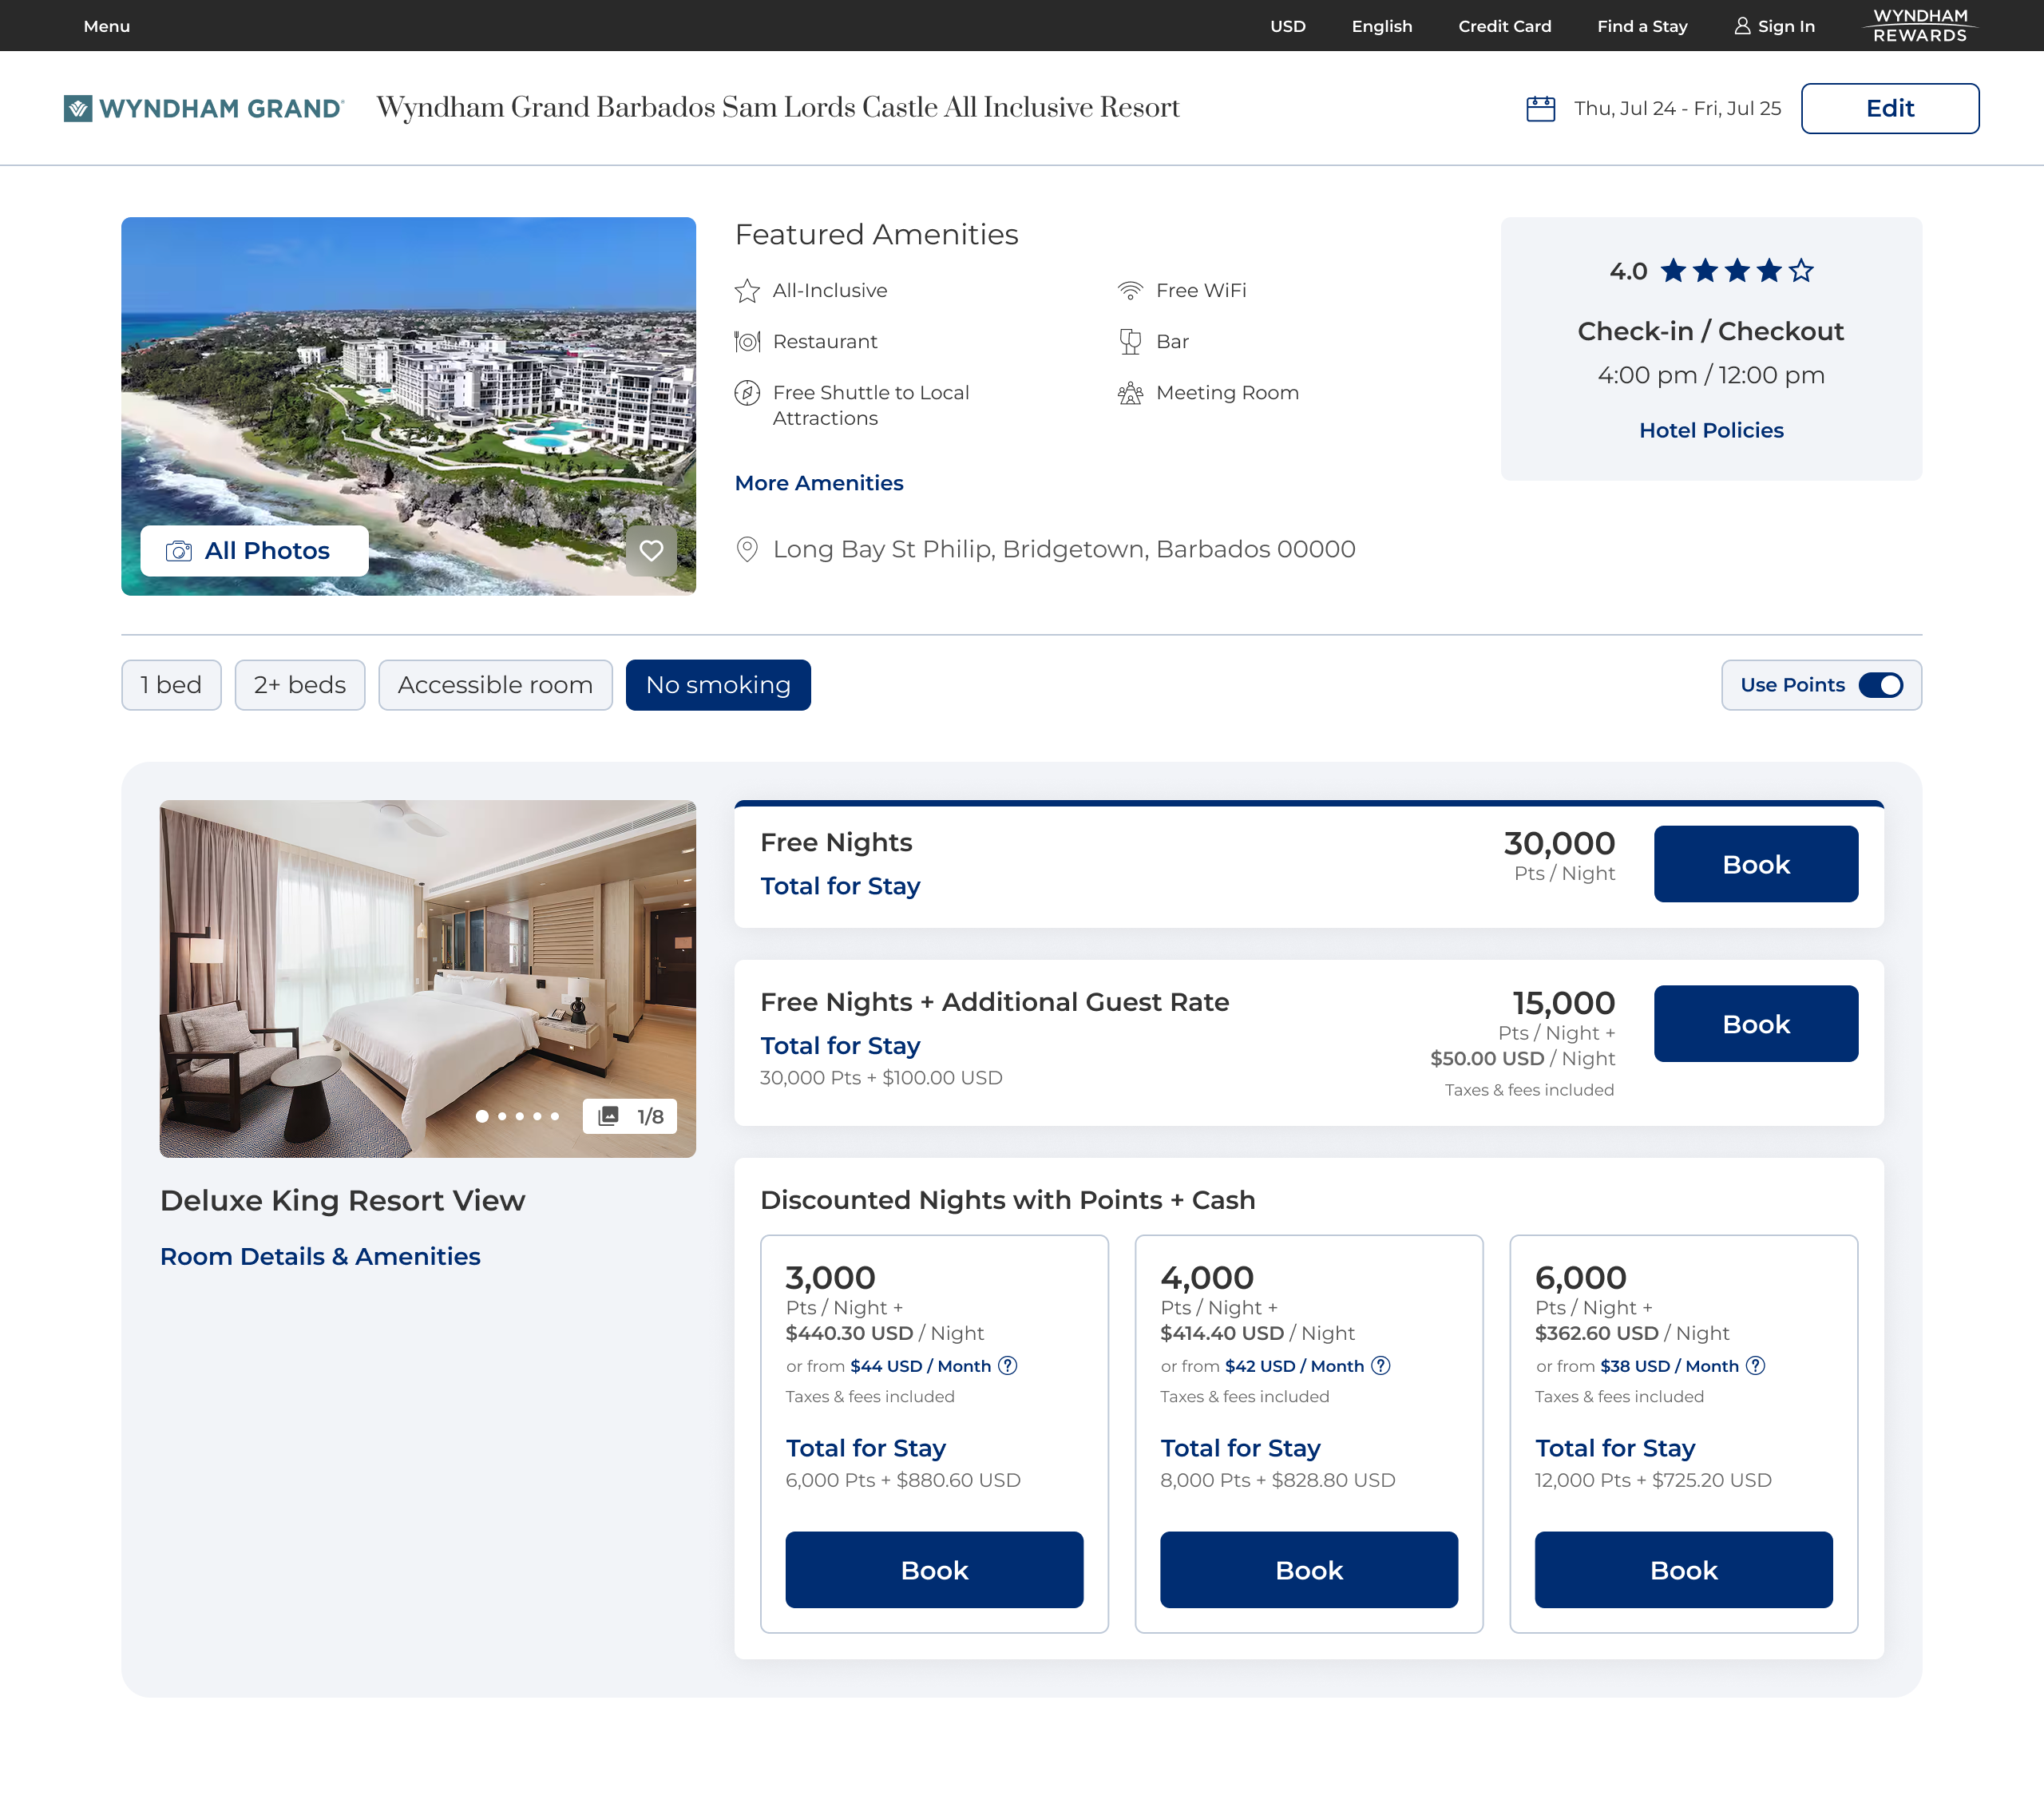
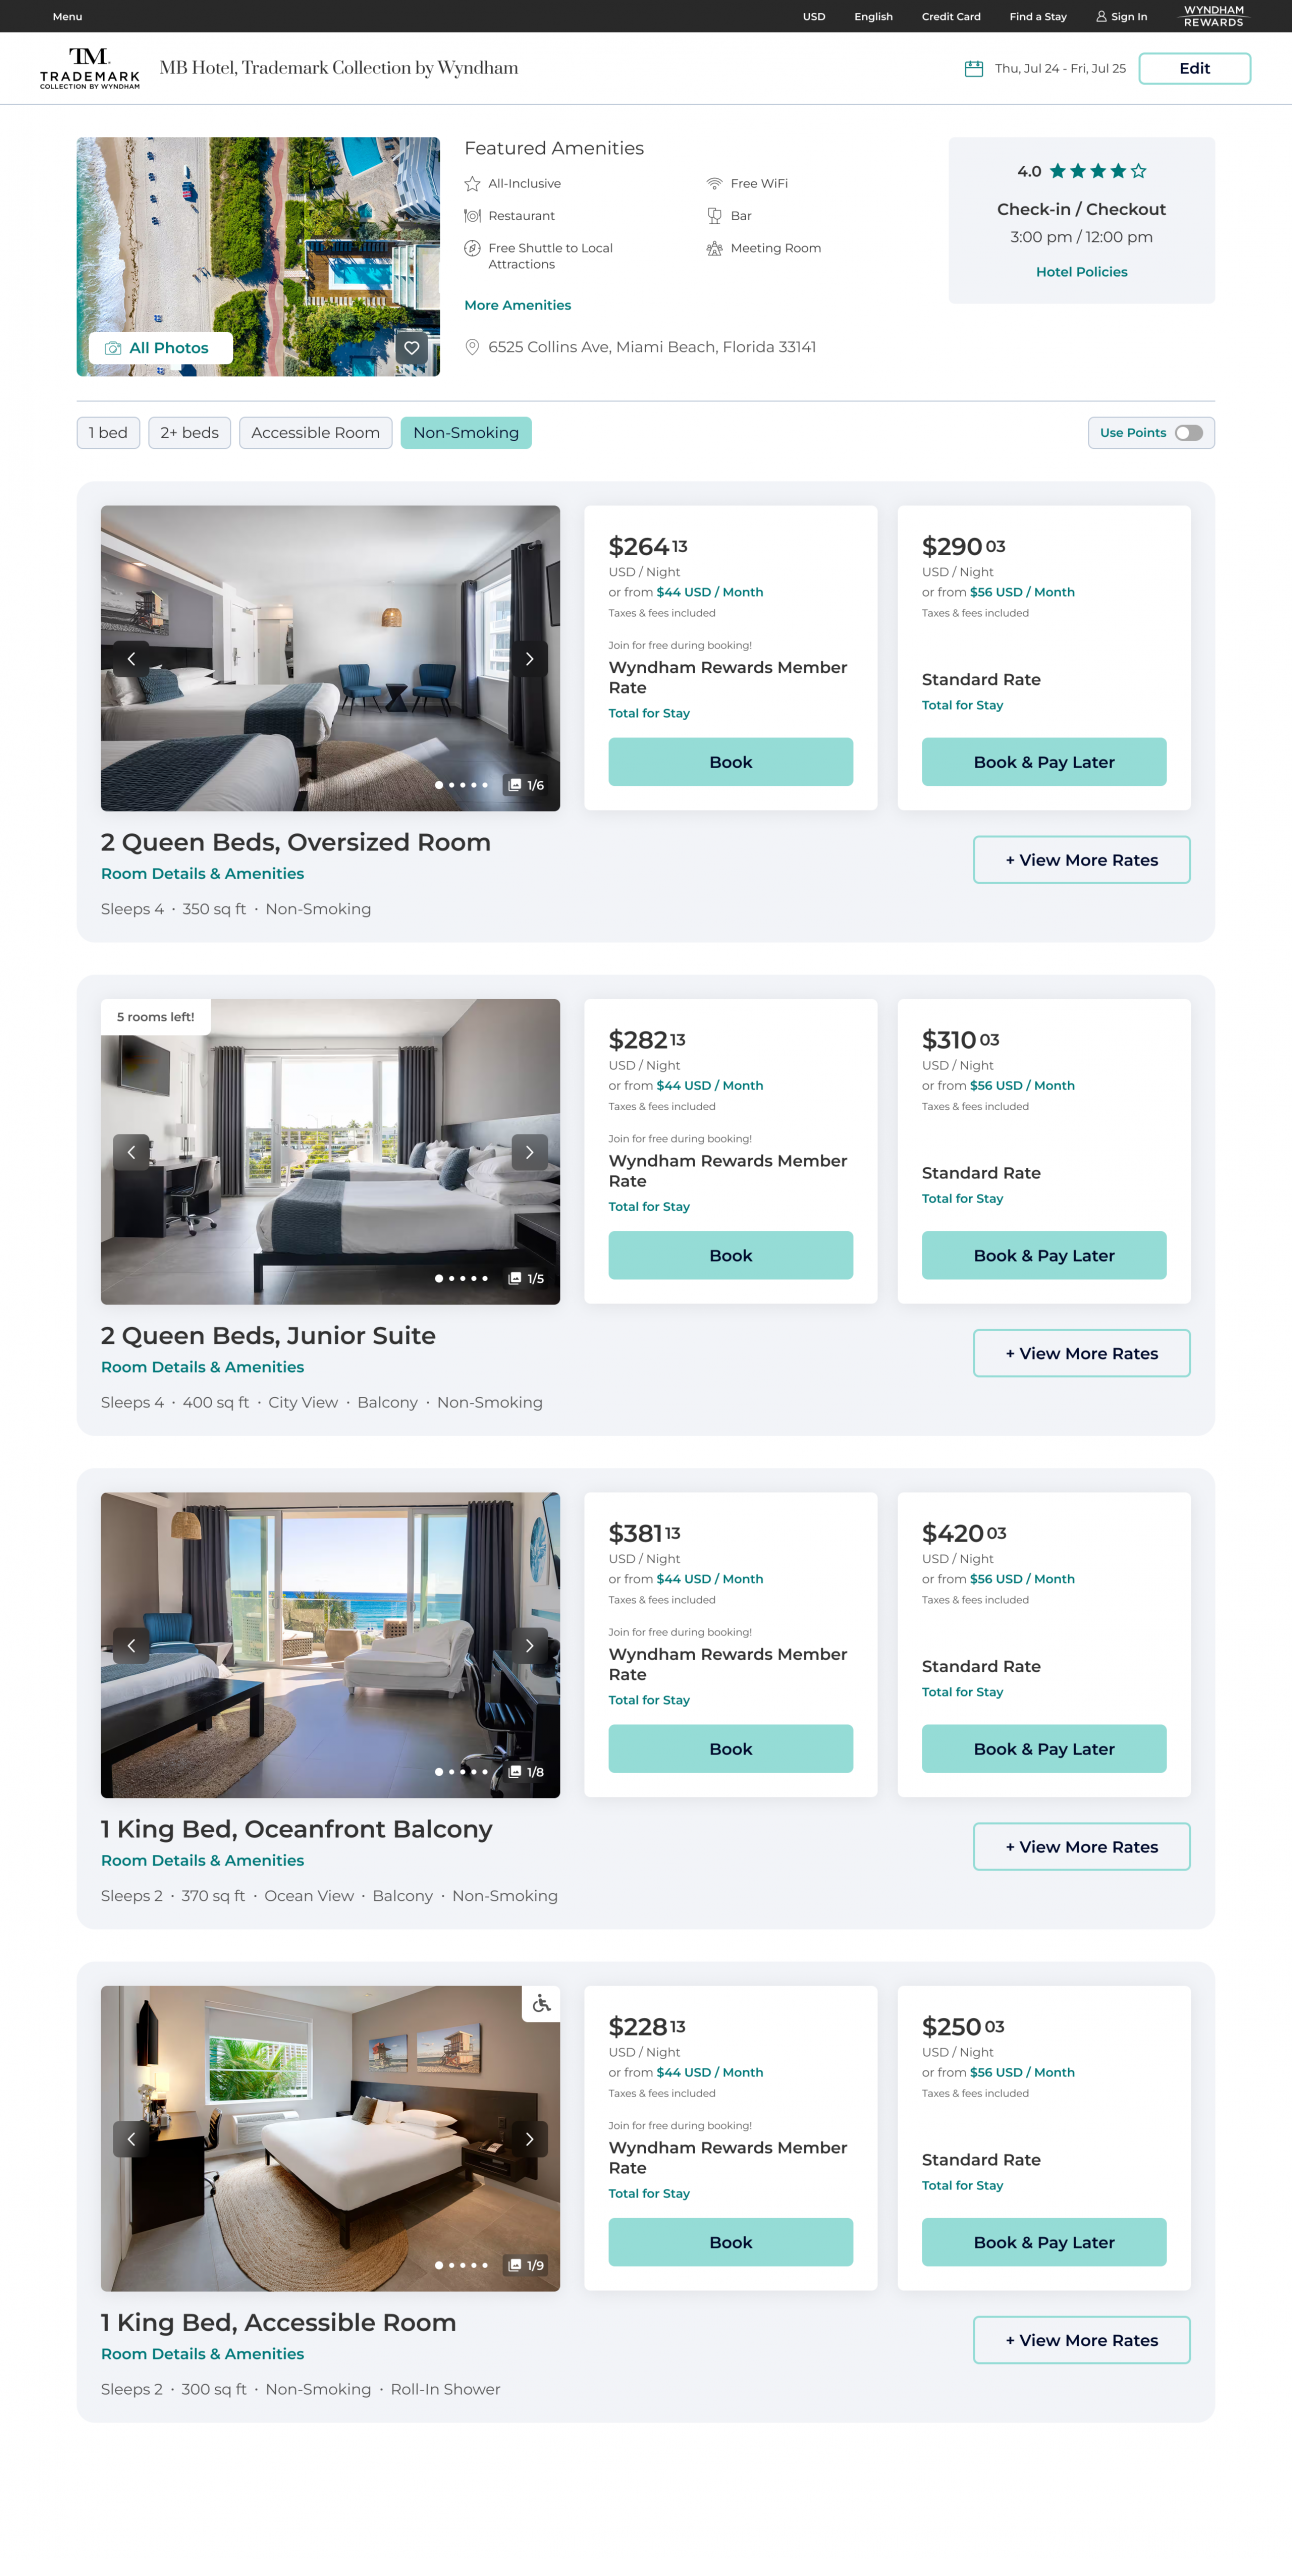
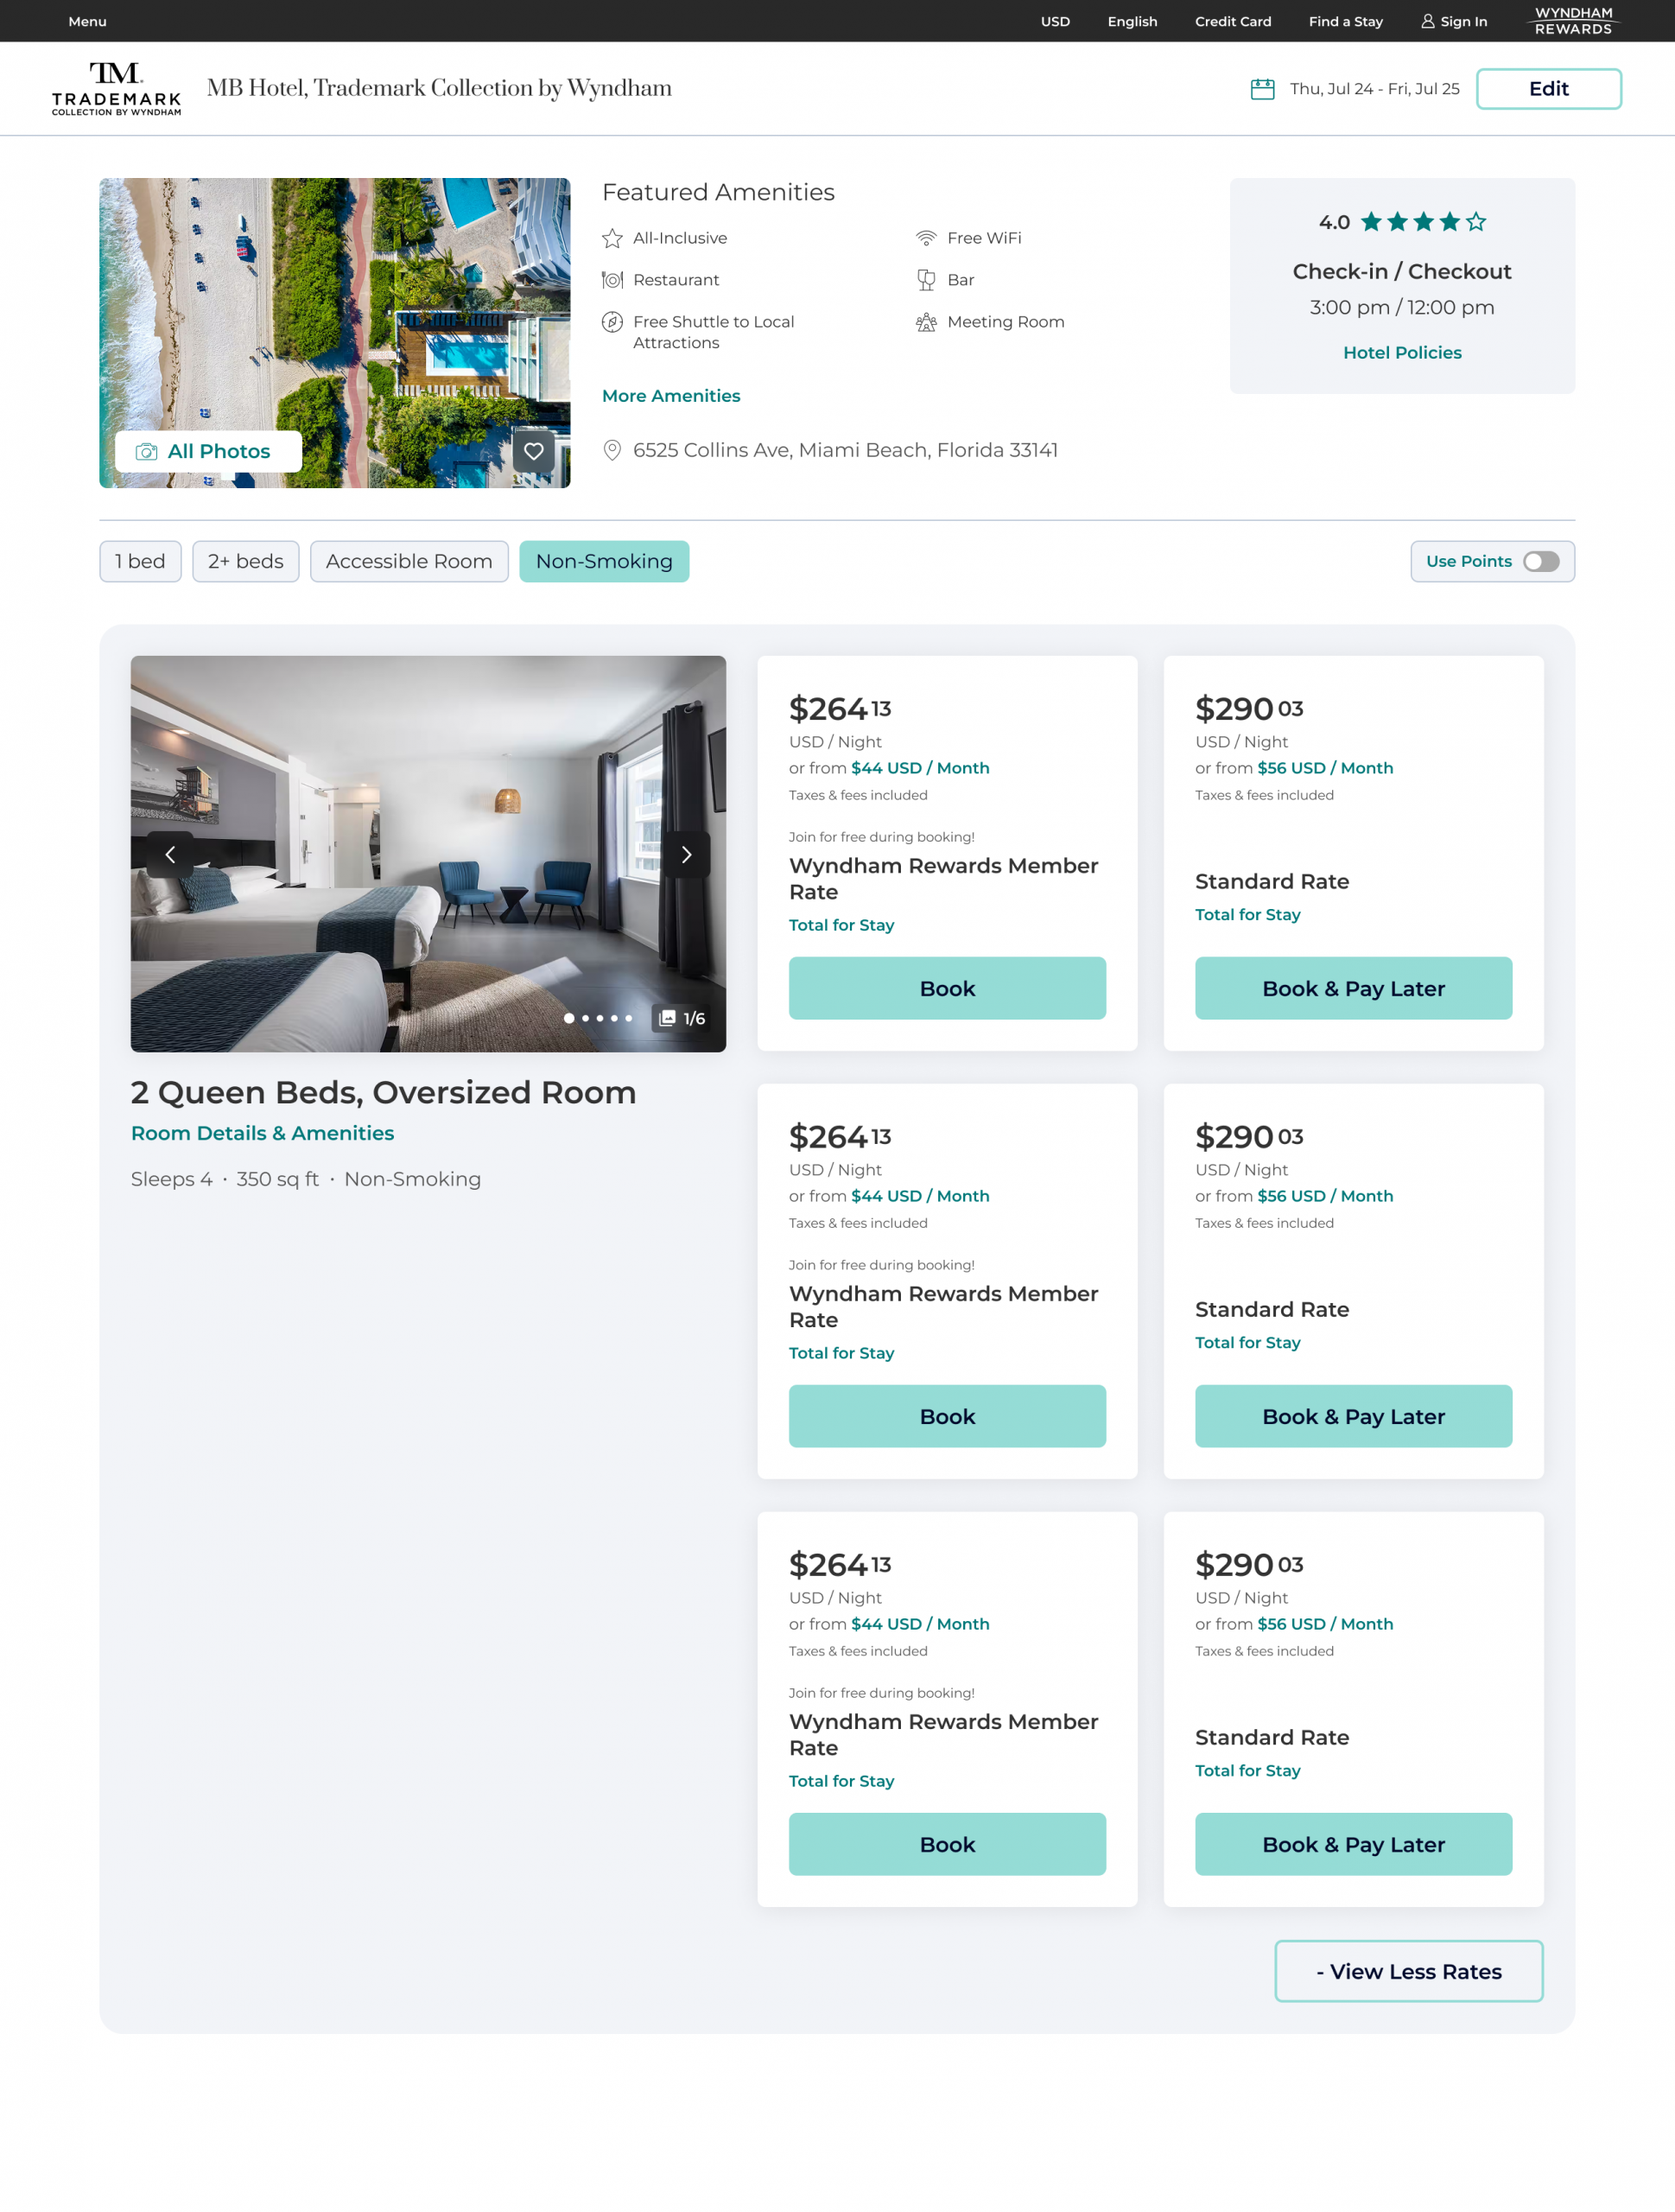
New Desktop Designs (Price + Points + Modal Views)
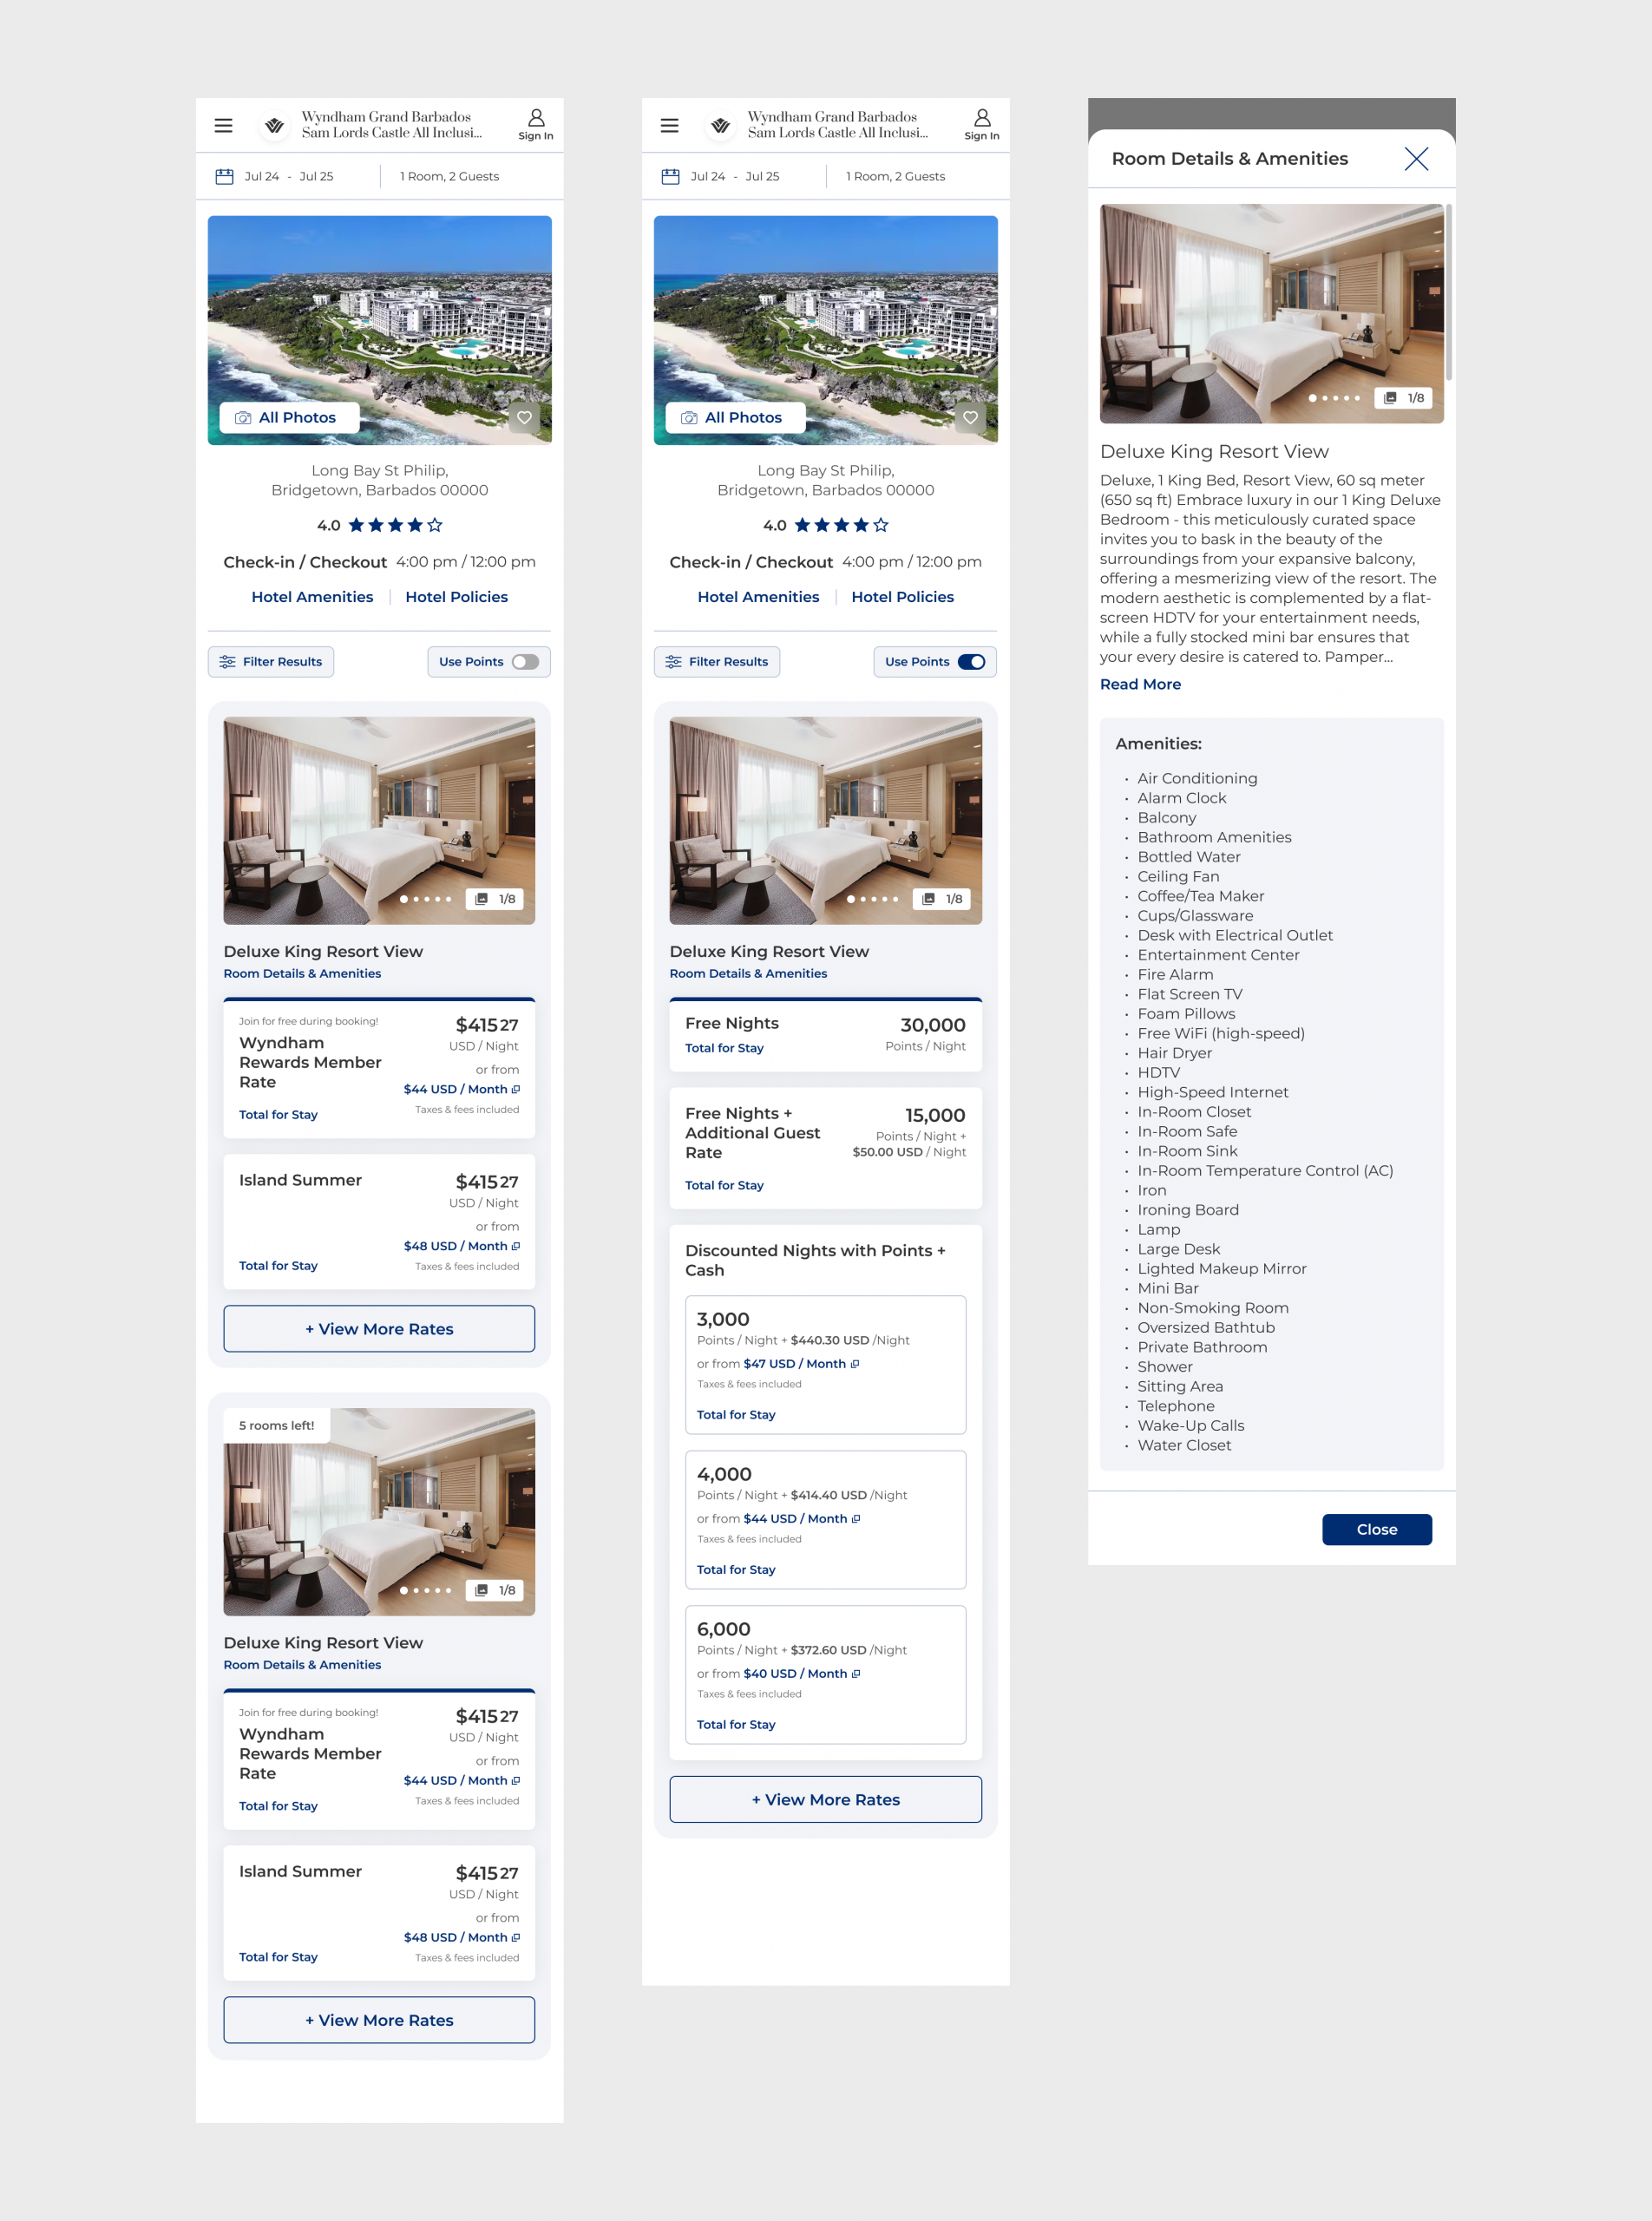
New Mobile Designs (Price + Points + Modal Views)
Key Findings
Overall Feedback of New Design:
Users found the page visually appealing and easy to navigate, with high-quality images and clearly listed amenities.
“Visually appealing and user-friendly. Not cluttered.”
“Larger and better quality images for rooms”
“Room amenities are easy to find and comprehensively listed”
“Room types and rates are clearly organized”
“I like the layout of the page because it makes it easy to find what you need and it’s not cluttered.”
Pain Points:
Room comparison was challenging: 32% of users found it difficult to compare rooms due to inconsistent room names and the need to click individual “Room Details & Amenities” links for each room, which made the process cumbersome and tedious.
Rate comparison was difficult: 32% of users couldn’t distinguish between rates due to vague titles and limited details (e.g., points, free breakfast, free cancellation, parking), increasing cognitive load and making quick booking decisions harder.
Users still struggled with the “Use Points” toggle: 32% didn’t know how to view rooms by points.
Future Considerations
“Quick Fixes” After Launch:
Anchor the filter bar and price/points toggle to the navigation and search widget so users don’t need to scroll back to the top to adjust filters and can easily switch between price and points—especially since the toggle is often missed.
What to A/B Test Next:
- Add short one line descriptions under current rate names for clarity and quick scanning.
- Provide main differentiators between rooms to enable quick scanning and easy comparison between room types:
- sleeps 2, 4, etc.
- square footage
- smoking vs non-smoking
- unique features of the room (e.g. balcony, ocean view, couch, kitchenette)
**These both would need engineering research to see how the information we have could be parsed to display the relevant info users need.
Larger Efforts that Need Further Research:
Standardize room and rate names with franchisees by providing a template or adopting a consistent naming structure. Consider including key rate details (e.g., free breakfast, free cancellation, perks) in smaller text underneath to support quick scanning and easier comparison.
A side by side comparison tool/modal where you can select rooms and compare the differences. Comparison tool? Choosing two rooms and putting their amenities side by side to compare.
Designs for Future Tests
Impact & Metrics
While metrics won’t be available until after launch, the objective of the new designs is to achieve at least parity with current booking performance, with the potential for improvement.